
New York City is a city of walkers. More trips are made on foot than by car (41% versus 28%) and the city’s “80X50” climate action plan envisions that 80% of all trips by 2050 will be made either on foot, by biking, or by public transit. The problem is that pedestrian movement in the city has remained largely unmapped and underestimated—until now.
Together with a team of researchers, Andres Sevtsuk, an associate professor in MIT’s Department of Urban Studies and Planning, has built what he says is the first complete model of pedestrian activity in New York City—and it’s a model that can now be applied to any U.S. city.
The model, which maps foot traffic across all sidewalks, crosswalks and footpaths in NYC during peak periods, reveals surprising patterns about the way people move around the city, as well as where they are most vulnerable to vehicle crashes (hint: it’s not Midtown Manhattan). It could have tremendous benefits for city planners.
The pitfalls of a car-centric country
Much ink has been spilled on the car-centricity of American cities. Americans average two vehicles per household (among the highest rates in the world) and car ownership has shaped everything from suburban sprawl to infrastructure spending priorities.
Over the past decades, transportation agencies have become experts at modeling traffic and predicting vehicle flows, but as Sevtsuk points out in a study accompanying the model that was published in the journal Nature Cities, “what gets counted, counts.” The amount of transportation infrastructure funding that states receive from the Federal Highway Administration, for example, relies on vehicle miles traveled in that state. The more residents of that state drive cars, the more funding the state receives.
If cities could count the number of pedestrians that walked across their streets, they could steer more federal money into urban, people-oriented infrastructure. But while car domination in the U.S. has long relied on tremendous lobbying from automakers, the pedestrian movement has had no champion pushing for data collection. “Nobody has monetized walking,” says Sevtsuk, “and this is actually a good thing.”
Until 1994, the U.S. didn’t even have an accurate roadway map. That year, President Bill Clinton signed an executive order directing federal agencies to build a standardized digital road network. As Sevtsuk explains, this helped revolutionize traffic modeling and paved the way for more efficient deliveries and various location-based services.
If a similar order were to help develop and standardize a pedestrian network nationwide, it would highlight where communities have systematically worse pedestrian infrastructure, and help target public space investments in places where they affect the most people.
The “Manhattan bias”
Over the past decade, Sevtsuk and his team have built various district-wide models in places like Melbourne, Australia, and Cambridge, MA, but they have never built a model at this scale. “A lot of cities don’t even know where their sidewalks are,” he says, “and the sad part is, some cities don’t want to know where sidewalks are.”
Indeed, cities face legal obligations under the Americans with Disabilities Act to maintain accessible sidewalks, but a comprehensive tracking system also exposes them to greater liability. The result, according to Sevtsuk, is a perverse incentive whereby cities that don’t systematically inventory their sidewalk conditions can more easily defend themselves against injury claims by arguing they weren’t aware of specific hazards.
In New York City, Sevtsuk’s model revealed illuminating findings. One of them has to do with the way street improvements are funded in the city. In 2020, the NYC Department of Transportation released a New York City Pedestrian Mobility Plan that laid out a road map for ongoing improvements for pedestrians and other road users. The plan laid out five corridor classification types intended to serve as a guideline for pedestrian infrastructure renovations. Most streets with the highest classification type—”global corridors” that would receive priority funding for sidewalk widening, pedestrian plazas, and other improvements—were located in Manhattan.
Sevtsuk acknowledges that many of these streets, including Broadway and Fifth Avenue, are important corridors, but his team’s model shows that 26 streets in the outer boroughs had higher pedestrian volume than 75% of the “global corridors” designated by NYC DOT, yet they were categorized lower, meaning they won’t receive the treatment or investment they deserve.
“We discovered there is a Manhattan bias in policymaking,” he says, noting the discrepancy was likely due to a lack of metrics. “They were guesstimating, and with guesstimation, we’re all flawed and have biases,” he added.
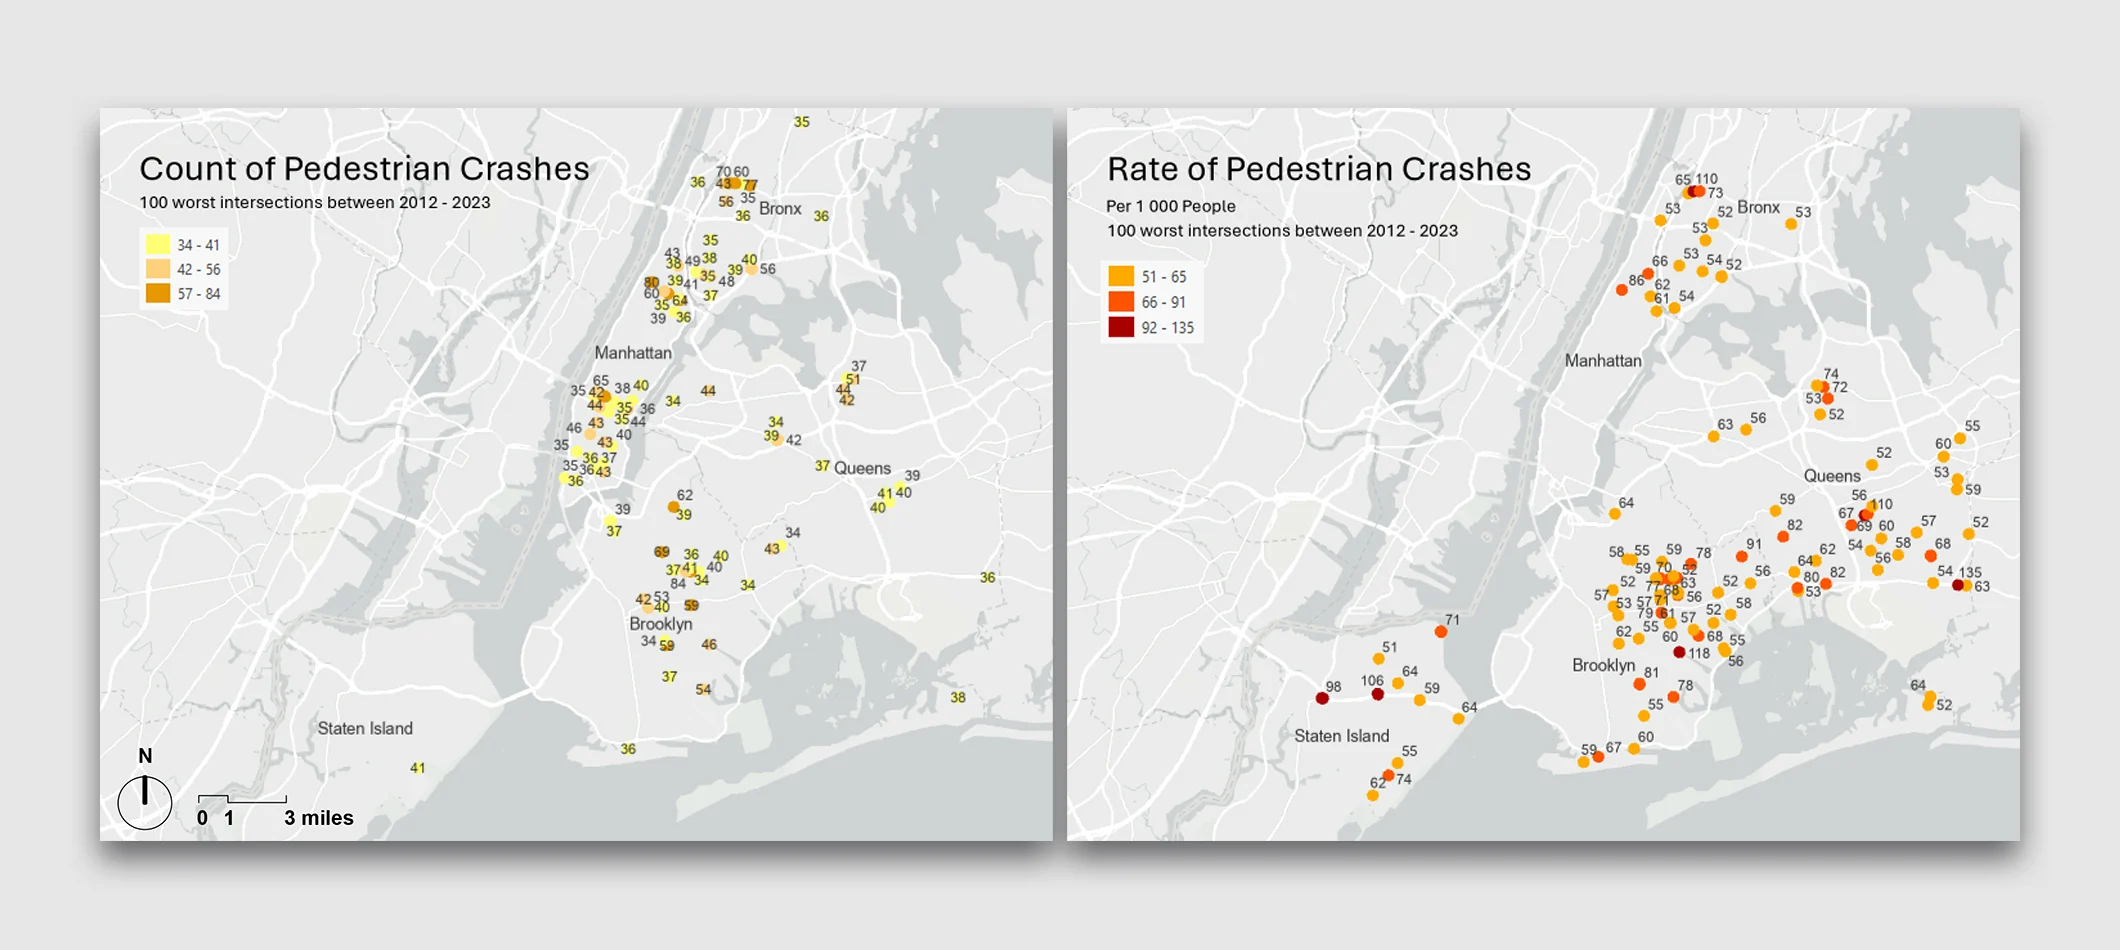
Another finding had to do with car crashes. For years, transportation officials have thought the highest number of pedestrian injuries involving vehicle crashes was around Times Square, in Manhattan. But these numbers never took crash rates per pedestrian into account, meaning they simply looked at where the most crashes occur, without considering the fact that there were more crashes simply because there were more people. “We need to take into account how many people actually walk there, then look at crash rates per pedestrian,” says Sevtsuk.
Using data from the model, the researchers mapped the rate of pedestrian crashes and found the highest concentration in The Bronx, Staten Island, as well as outer regions of Brooklyn and Queens. Not a single street below 125th in Manhattan lit up on the map. “Midtown sees a lot of crashes but it’s a safe place to walk because it has very high level of foot traffic,” says Sevtsuk.
A template for cities worldwide
The implications of the team’s work extend far beyond New York City. In fact, what makes the model particularly powerful for other cities is how adaptable it is.
The researchers’ approach builds on a framework called Urban Network Analysis that Sevtsuk and his team have been developing for a decade. The team started by assembling data on where in NYC sidewalks, crosswalks, and footpaths are located, then mapping major trip origins and destinations—think home to school, job to subway, or restaurant to park. They then simulated how pedestrians move between these locations, accounting for the fact that people don’t always take the shortest route and often have multiple subway stops to choose from.
Using pedestrian counts from over 1,000 locations from NYC DOT as “ground truth,” the team calibrated the model using machine learning to ensure the estimates matched real-world observations. Once calibrated at those locations, the model could predict pedestrian volumes across every street in the city. The process took about a year to complete, “but relatively speaking, it’s still much easier than building a full-fledged traffic model,” says Sevtsuk.
The researchers are now working with 140 cities across the state of Maine to better understand the kinds of upgrades and safety improvements they could make for pedestrians. They have also partnered with LA Metro to identify opportunities where the city could do small but important interventions that would help them better prepare for the LA28 Olympic Games, but also everyday users. “They are trying to use [the interventions] as a kind of legacy, using some of the Games’ budget to support walking in the city,” says Sevtsuk.