
Every business eventually reaches a moment when its revenue finally covers its costs. Before that point, the company is effectively investing in its own operations, spending money on rent, salaries, materials, and marketing while sales gradually catch up. Once revenue equals expenses, the business has reached what’s known as the break-even point.
For many entrepreneurs, understanding when this moment will happen is one of the most important parts of financial planning. Knowing your break-even point helps answer critical questions:
- How much do you need to sell to cover your costs?
- Is your pricing sustainable?
- How long might it take before a new product or business idea becomes profitable?
This is where break-even analysis becomes useful. By examining the relationship between costs, pricing, and sales volume, break-even analysis helps business owners estimate when their company will begin generating profit. Whether you’re launching a startup, introducing a new product, or evaluating the performance of an existing business, understanding this calculation can provide valuable insight into your financial strategy.
Key Takeaways
- The break-even point is when total revenue equals total costs.
- Break-even analysis shows how much a business needs to sell before it becomes profitable.
- The calculation depends on fixed costs, variable costs, and contribution margin.
- Lower costs or higher prices reduce the break-even threshold.
- Break-even analysis helps businesses plan pricing, sales targets, and profitability.
- It works best when combined with broader financial planning tools.
What Is the Break-Even Point?
The break-even point is when a business’s total revenue equals its total costs. At this stage, the company is no longer losing money, but it has not yet begun generating profit either. Every dollar earned beyond this point contributes directly to profit because the initial operating costs have already been covered.
Reaching the break-even point is an important milestone for any business. It represents the moment when operations begin to sustain themselves financially rather than relying on startup capital or borrowed funds. For new businesses, understanding how long it may take to reach this stage can help set realistic expectations for growth.
The break-even point also provides useful insight for established companies. When launching new products, adjusting pricing, or expanding operations, businesses often calculate a new break-even point to understand how much sales volume will be required to support those changes.
Break-Even Point vs Break-Even Analysis
Although the terms are often used together, the break-even point and break-even analysis refer to different concepts.
The break-even point is the specific level of sales where revenue and costs are equal. It is a single figure that represents the threshold between operating at a loss and becoming profitable.

Break-even analysis, on the other hand, is the process used to calculate that threshold. This analysis examines how costs, pricing, and sales volume interact. By adjusting these variables, businesses can explore different scenarios and better understand how changes might affect profitability.
For example, increasing prices or reducing costs will lower the break-even point. On the other hand, higher operating expenses or lower margins will push it further away, requiring greater sales volume before profits begin.
How to Calculate the Break-Even Point in 3 Steps
Calculating the break-even point may sound complicated at first, but the process is actually quite straightforward when you break it down into a few steps. The goal is to figure out how much a business needs to sell before it covers all of its operating costs. Once you know this number, it becomes much easier to set realistic sales targets and understand how close your business is to becoming profitable.
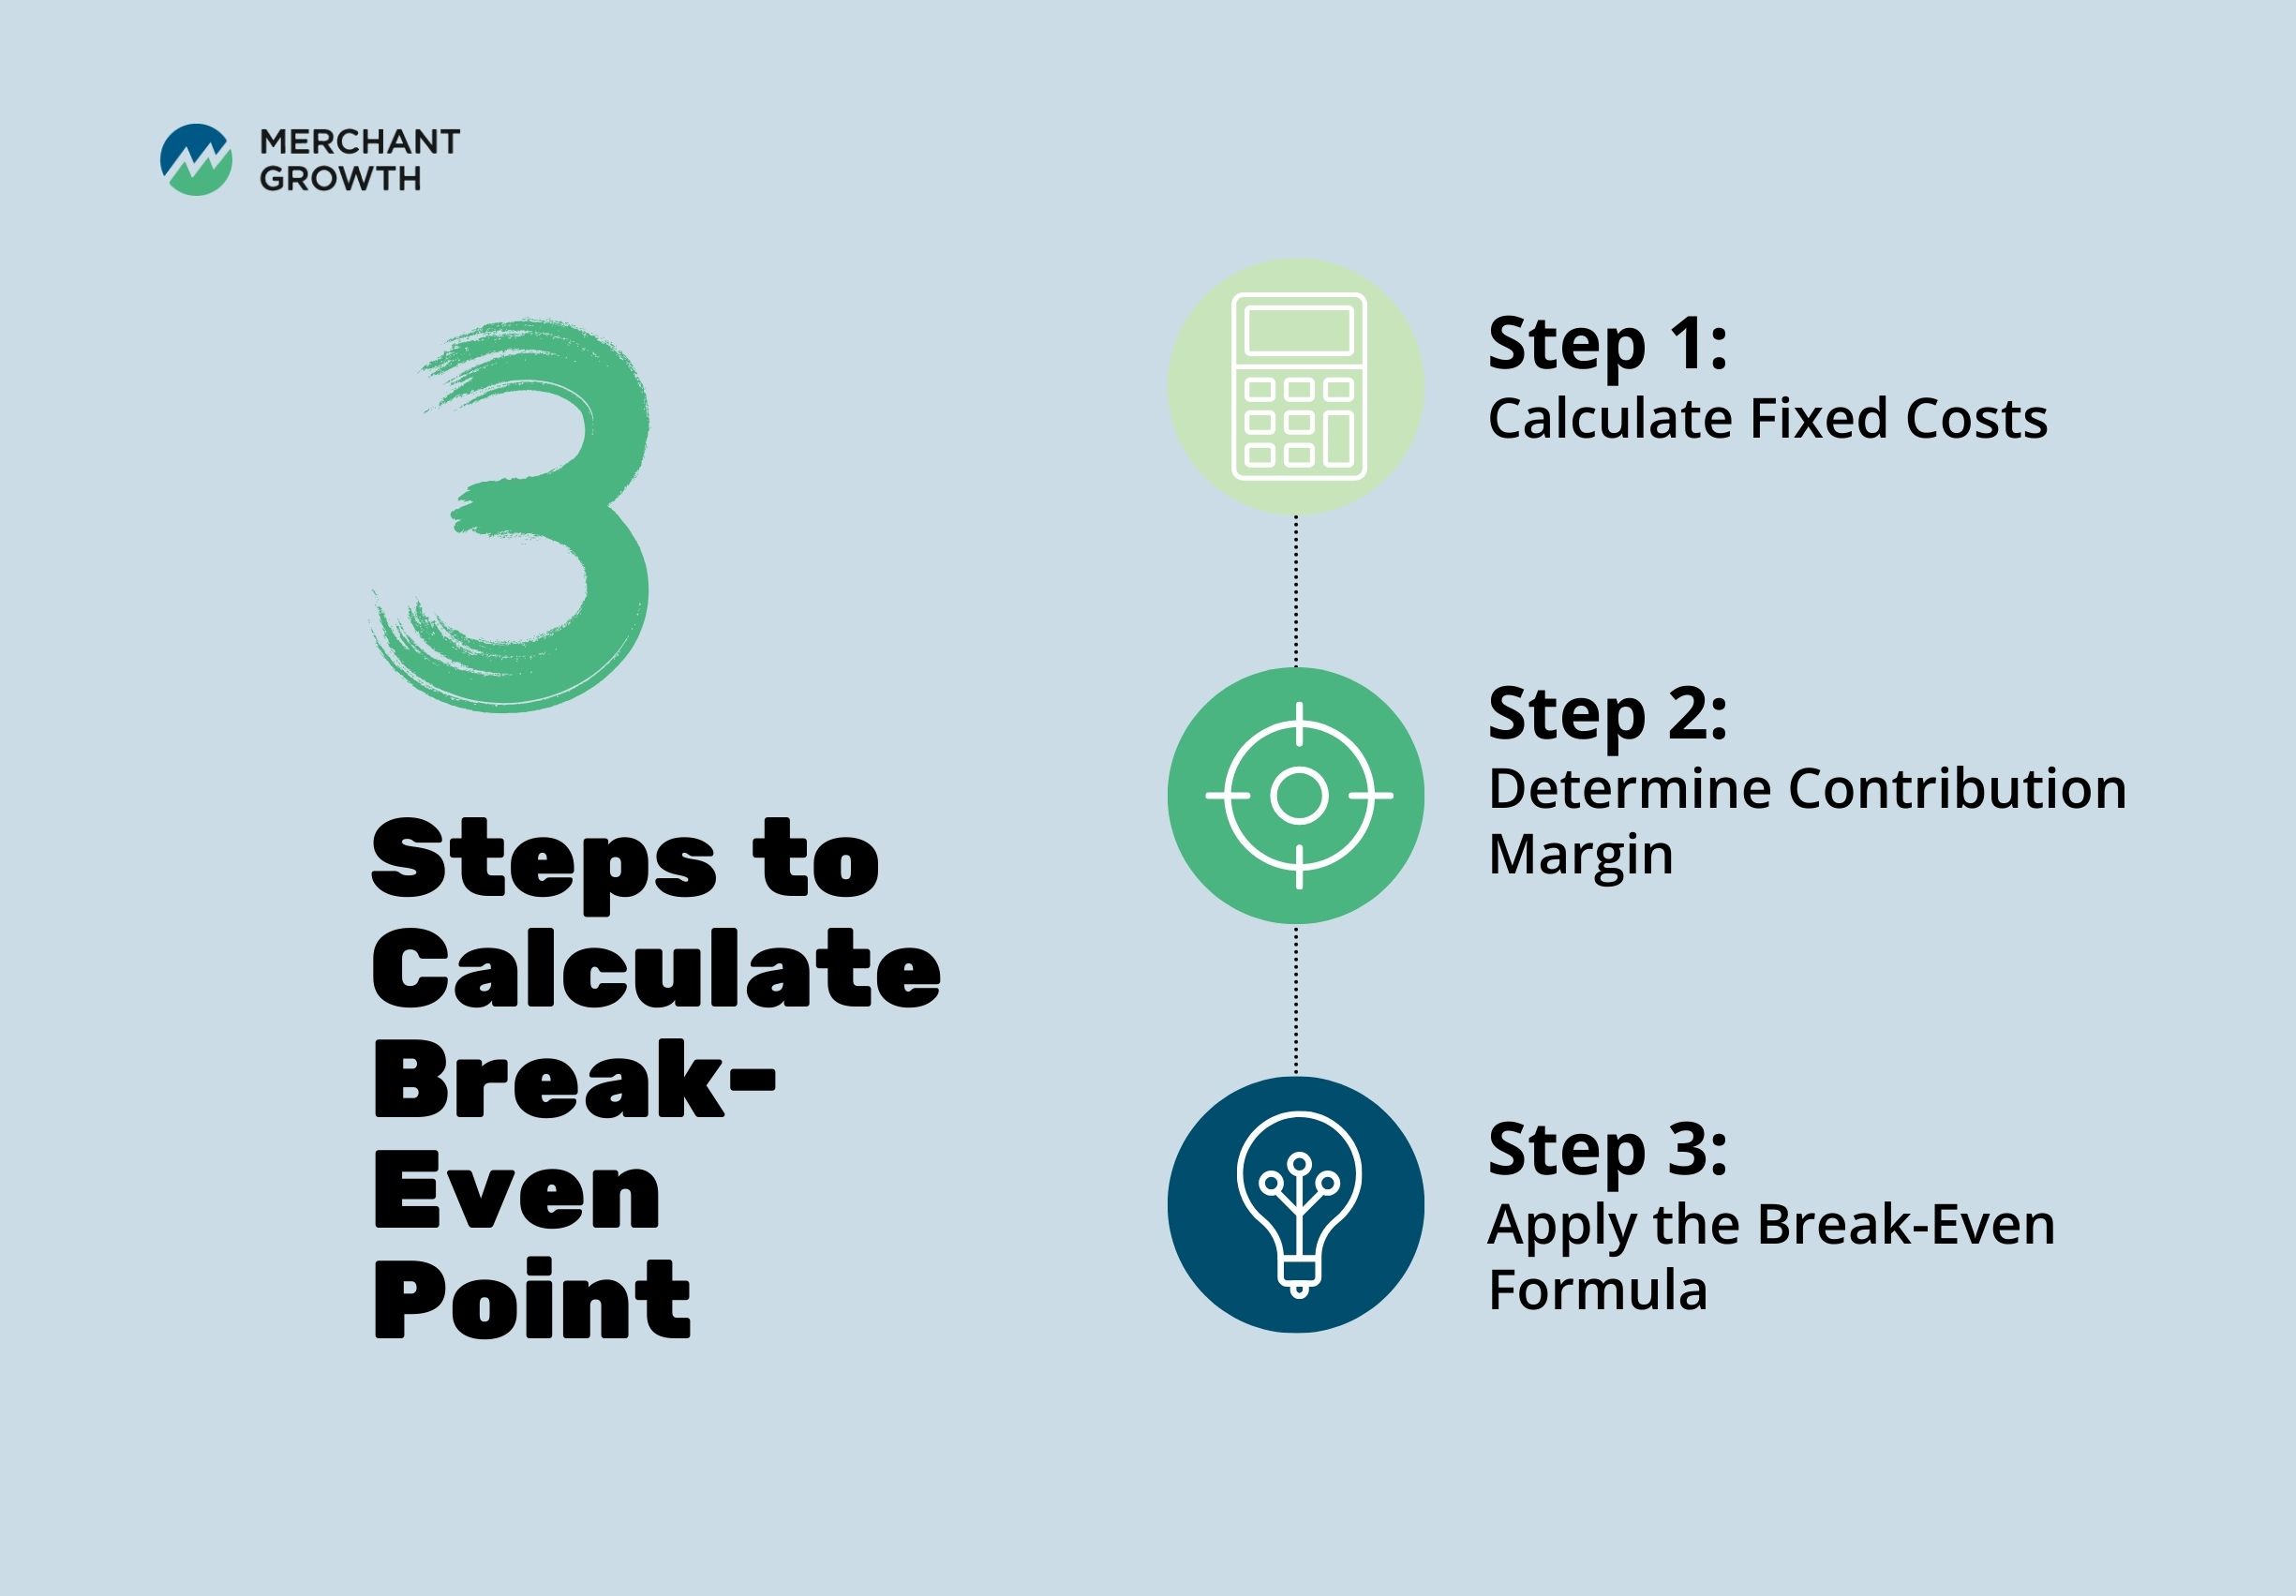
Step 1: Calculate Fixed Costs
The first step is identifying your fixed costs. These are expenses that stay the same regardless of how much your business sells. Whether you sell one product or one thousand, these costs still need to be paid each month.
Typical fixed costs include:
- Rent or mortgage payments
- Salaries and wages
- Insurance
- Software subscriptions
- Utilities
Because fixed costs remain relatively stable, they provide the starting point for calculating your break-even point. Understanding these expenses clearly helps you determine how much revenue your business must generate before it begins making a profit.
Step 2: Determine Contribution Margin
Next, you’ll need to calculate your contribution margin. This number shows how much money each sale contributes toward covering fixed costs after the cost of producing the product has been accounted for.
The formula looks like this:

Contribution Margin = Price per Unit – Variable Cost per Unit
For example, if a product sells for $100 and costs $60 to produce, the contribution margin is $40. That means every sale contributes $40 toward covering fixed expenses such as rent, salaries, and other operating costs.
Step 3: Apply the Break-Even Formula
Once you know your fixed costs and contribution margin, calculating the break-even point becomes simple. You can use the following formula:

Break-Even Point (Units) = Fixed Costs ÷ Contribution Margin
This calculation shows how many units a business needs to sell before it covers all of its costs. Once sales pass that number, the business begins generating profit because the fixed costs have already been paid.
Once these numbers are clear, calculating your break-even point becomes much easier. By understanding how fixed costs, variable costs, and contribution margin work together, business owners can see how pricing decisions, cost changes, or shifts in sales volume will affect profitability. The next step is to take a closer look at these key components and how they influence the break-even calculation.
The Key Components of Break-Even Analysis
Break-even analysis is built on a few core financial variables that determine how quickly a business can move from covering its costs to generating profit. These variables help business owners understand how pricing, production costs, and operating expenses interact with one another. When these components are clearly defined, it becomes much easier to estimate how much revenue is required to sustain the business.
Before applying the break-even formula, it is important to understand the three key elements that drive the calculation: fixed costs, variable costs, and contribution margin. Each plays a different role in determining how much a business must sell to cover its expenses.
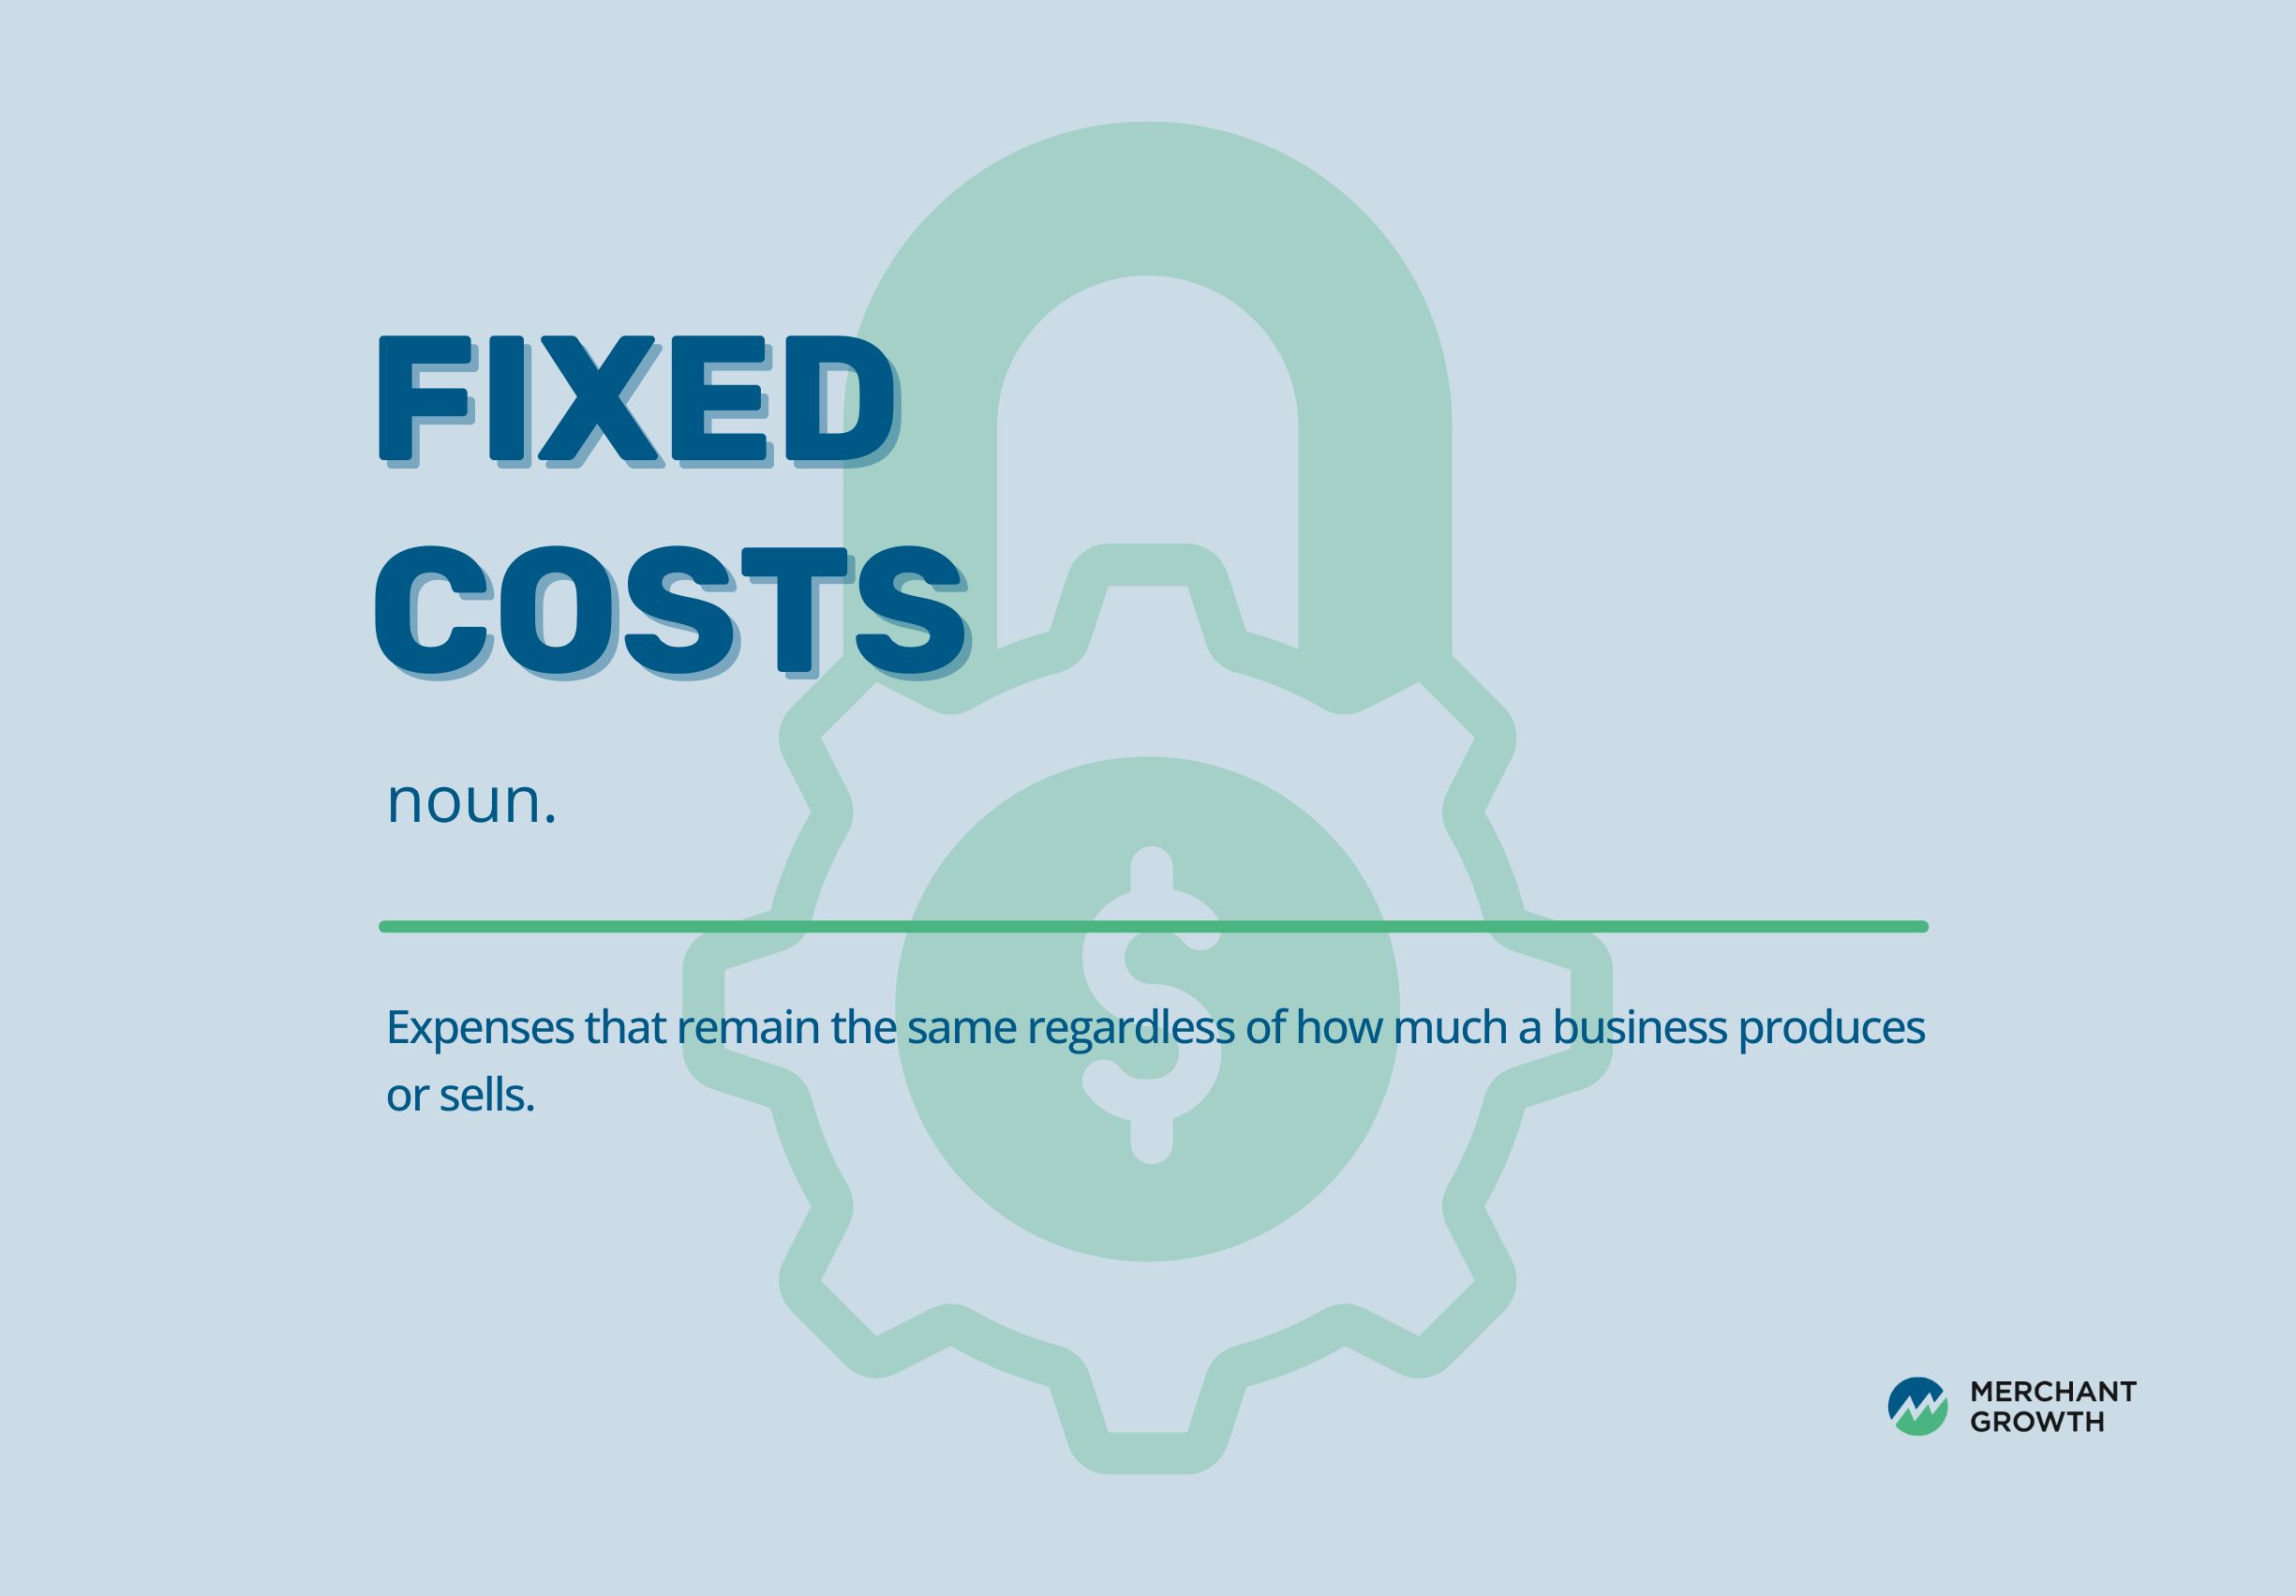
Fixed Costs
Fixed costs are expenses that remain the same regardless of how much a business produces or sells. These costs must be paid regularly, even during periods when sales slow down or fluctuate. Because they do not change with production levels, fixed costs often represent the baseline amount a business must cover before it can begin earning a profit.
Common examples of fixed costs include rent, salaries, insurance, and software subscriptions. These ongoing expenses form the foundation of a break-even calculation because they represent the minimum financial commitment required to keep the business operating.
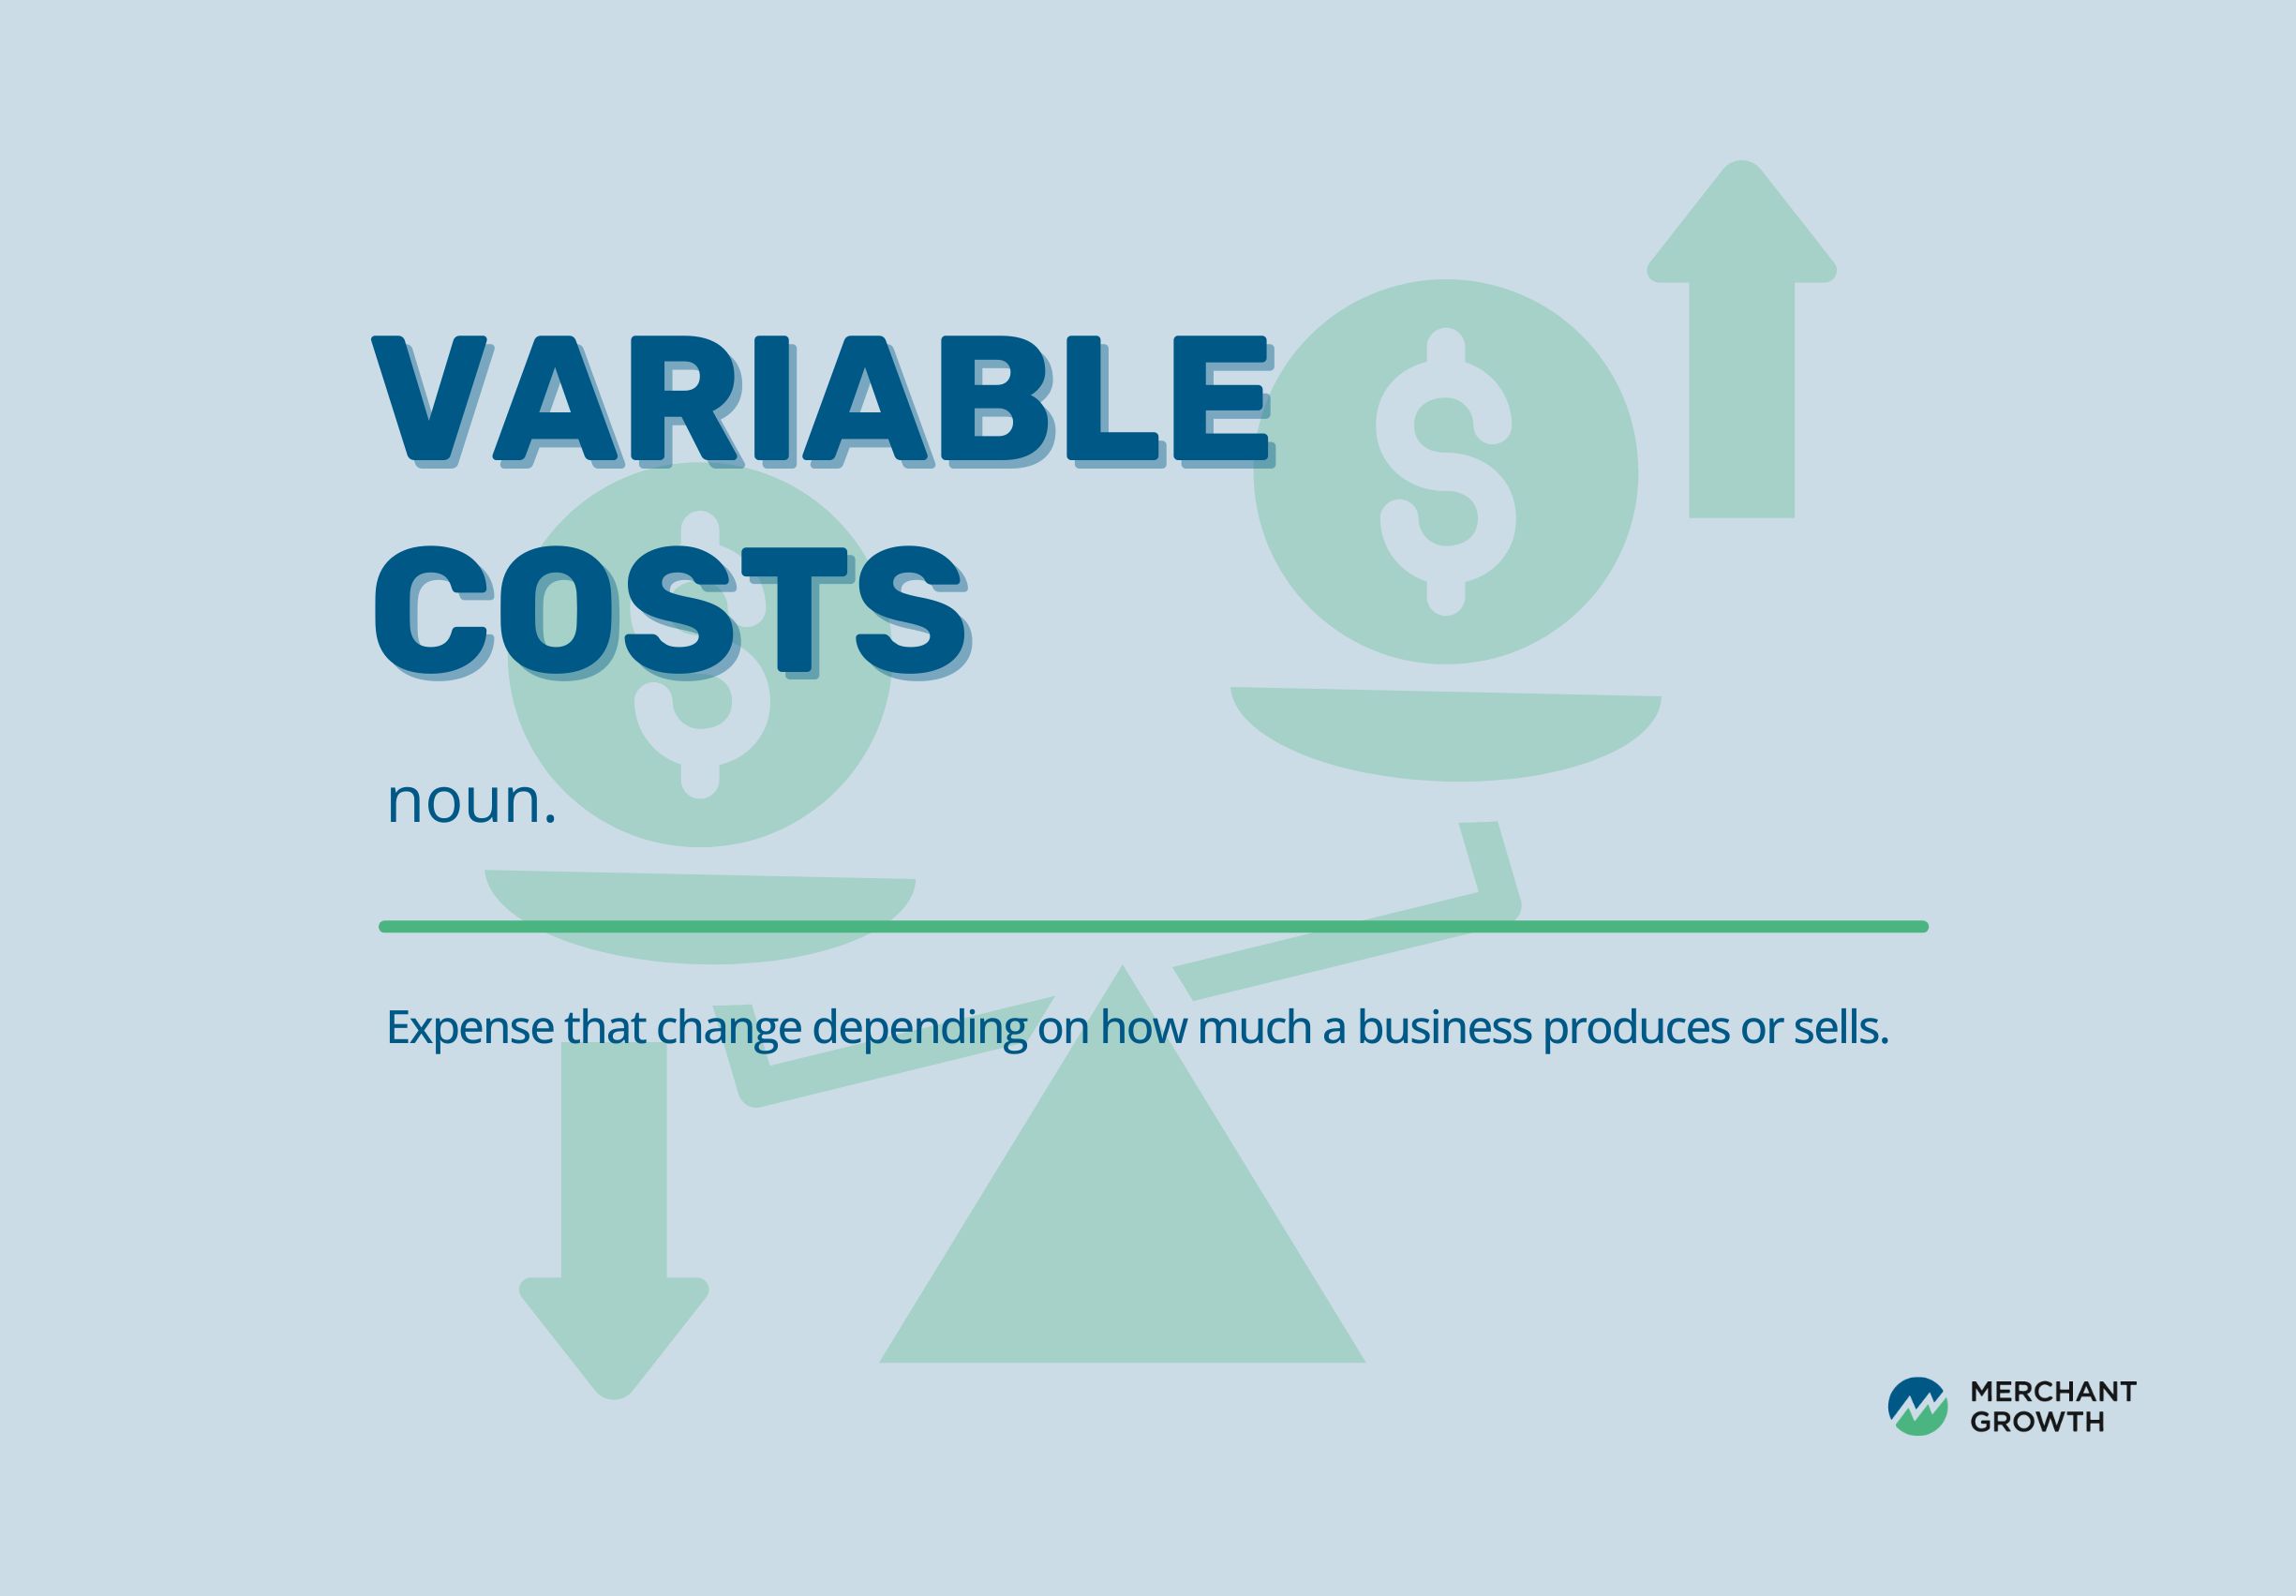
Variable Costs
Variable costs, as the name suggests, change depending on how much a business produces or sells. When production increases, these costs rise accordingly, and when production slows, they decrease. Because they are tied directly to sales activity, variable costs are closely linked to a company’s revenue generation.
Examples of variable costs include raw materials, packaging, shipping, and sales commissions. Understanding these costs is important because they affect how much profit remains from each sale after production expenses are covered.
Contribution Margin
The contribution margin represents the portion of revenue from each sale that helps cover fixed costs. It is calculated by subtracting the variable cost per unit from the selling price of the product or service. Once fixed costs have been fully covered, any remaining contribution margin becomes profit.
By understanding contribution margin, businesses can see how changes in pricing or production costs may influence their path to profitability. Even small adjustments in margins can significantly affect how quickly a company reaches its break-even point.
Break-Even Point Formula (Units)
Once the key components are clear, the break-even point can be calculated using a straightforward formula. Many businesses begin by measuring break-even in terms of units sold, which makes it easier to connect the calculation directly to sales activity.
The formula is:

Break-Even Point (Units) = Fixed Costs ÷ (Price per Unit – Variable Cost per Unit)
This equation highlights the relationship between costs, pricing, and sales volume. If operating costs increase or prices decrease, the number of units required to break even will rise. On the other hand, improving margins through pricing adjustments or cost reductions can lower the break-even threshold and help businesses reach profitability sooner.
Break-Even Point Formula (Sales Dollars)
While calculating break-even in units works well for product-based businesses, some companies prefer to measure break-even in terms of total revenue. This approach is particularly useful for service-based businesses that may not sell standardized products.
The formula for calculating break-even in revenue terms is:

Break-Even Sales = Fixed Costs ÷ Contribution Margin Ratio
Instead of focusing on the number of units sold, this calculation shows how much total revenue must be generated before a business begins producing profit. For service businesses, consultants, and subscription-based companies, this revenue-based perspective can provide a clearer picture of financial performance.

Example of Break-Even Analysis
To better understand how break-even analysis works in practice, it helps to walk through a simple example. Consider a business with the following financial structure:
- Fixed costs: $50,000
- Price per unit: $100
- Variable cost per unit: $60
First, calculate the contribution margin:
$100 – $60 = $40
Next, divide the fixed costs by the contribution margin:
$50,000 ÷ $40 = 1,250 units
This means the business must sell 1,250 units before it begins generating profit. Once that threshold has been reached, each additional sale contributes directly to the company’s bottom line.
Break-Even Chart Explained
Break-even analysis is often easier to understand when visualized using a chart. This chart illustrates how revenue and costs change as sales volume increases.
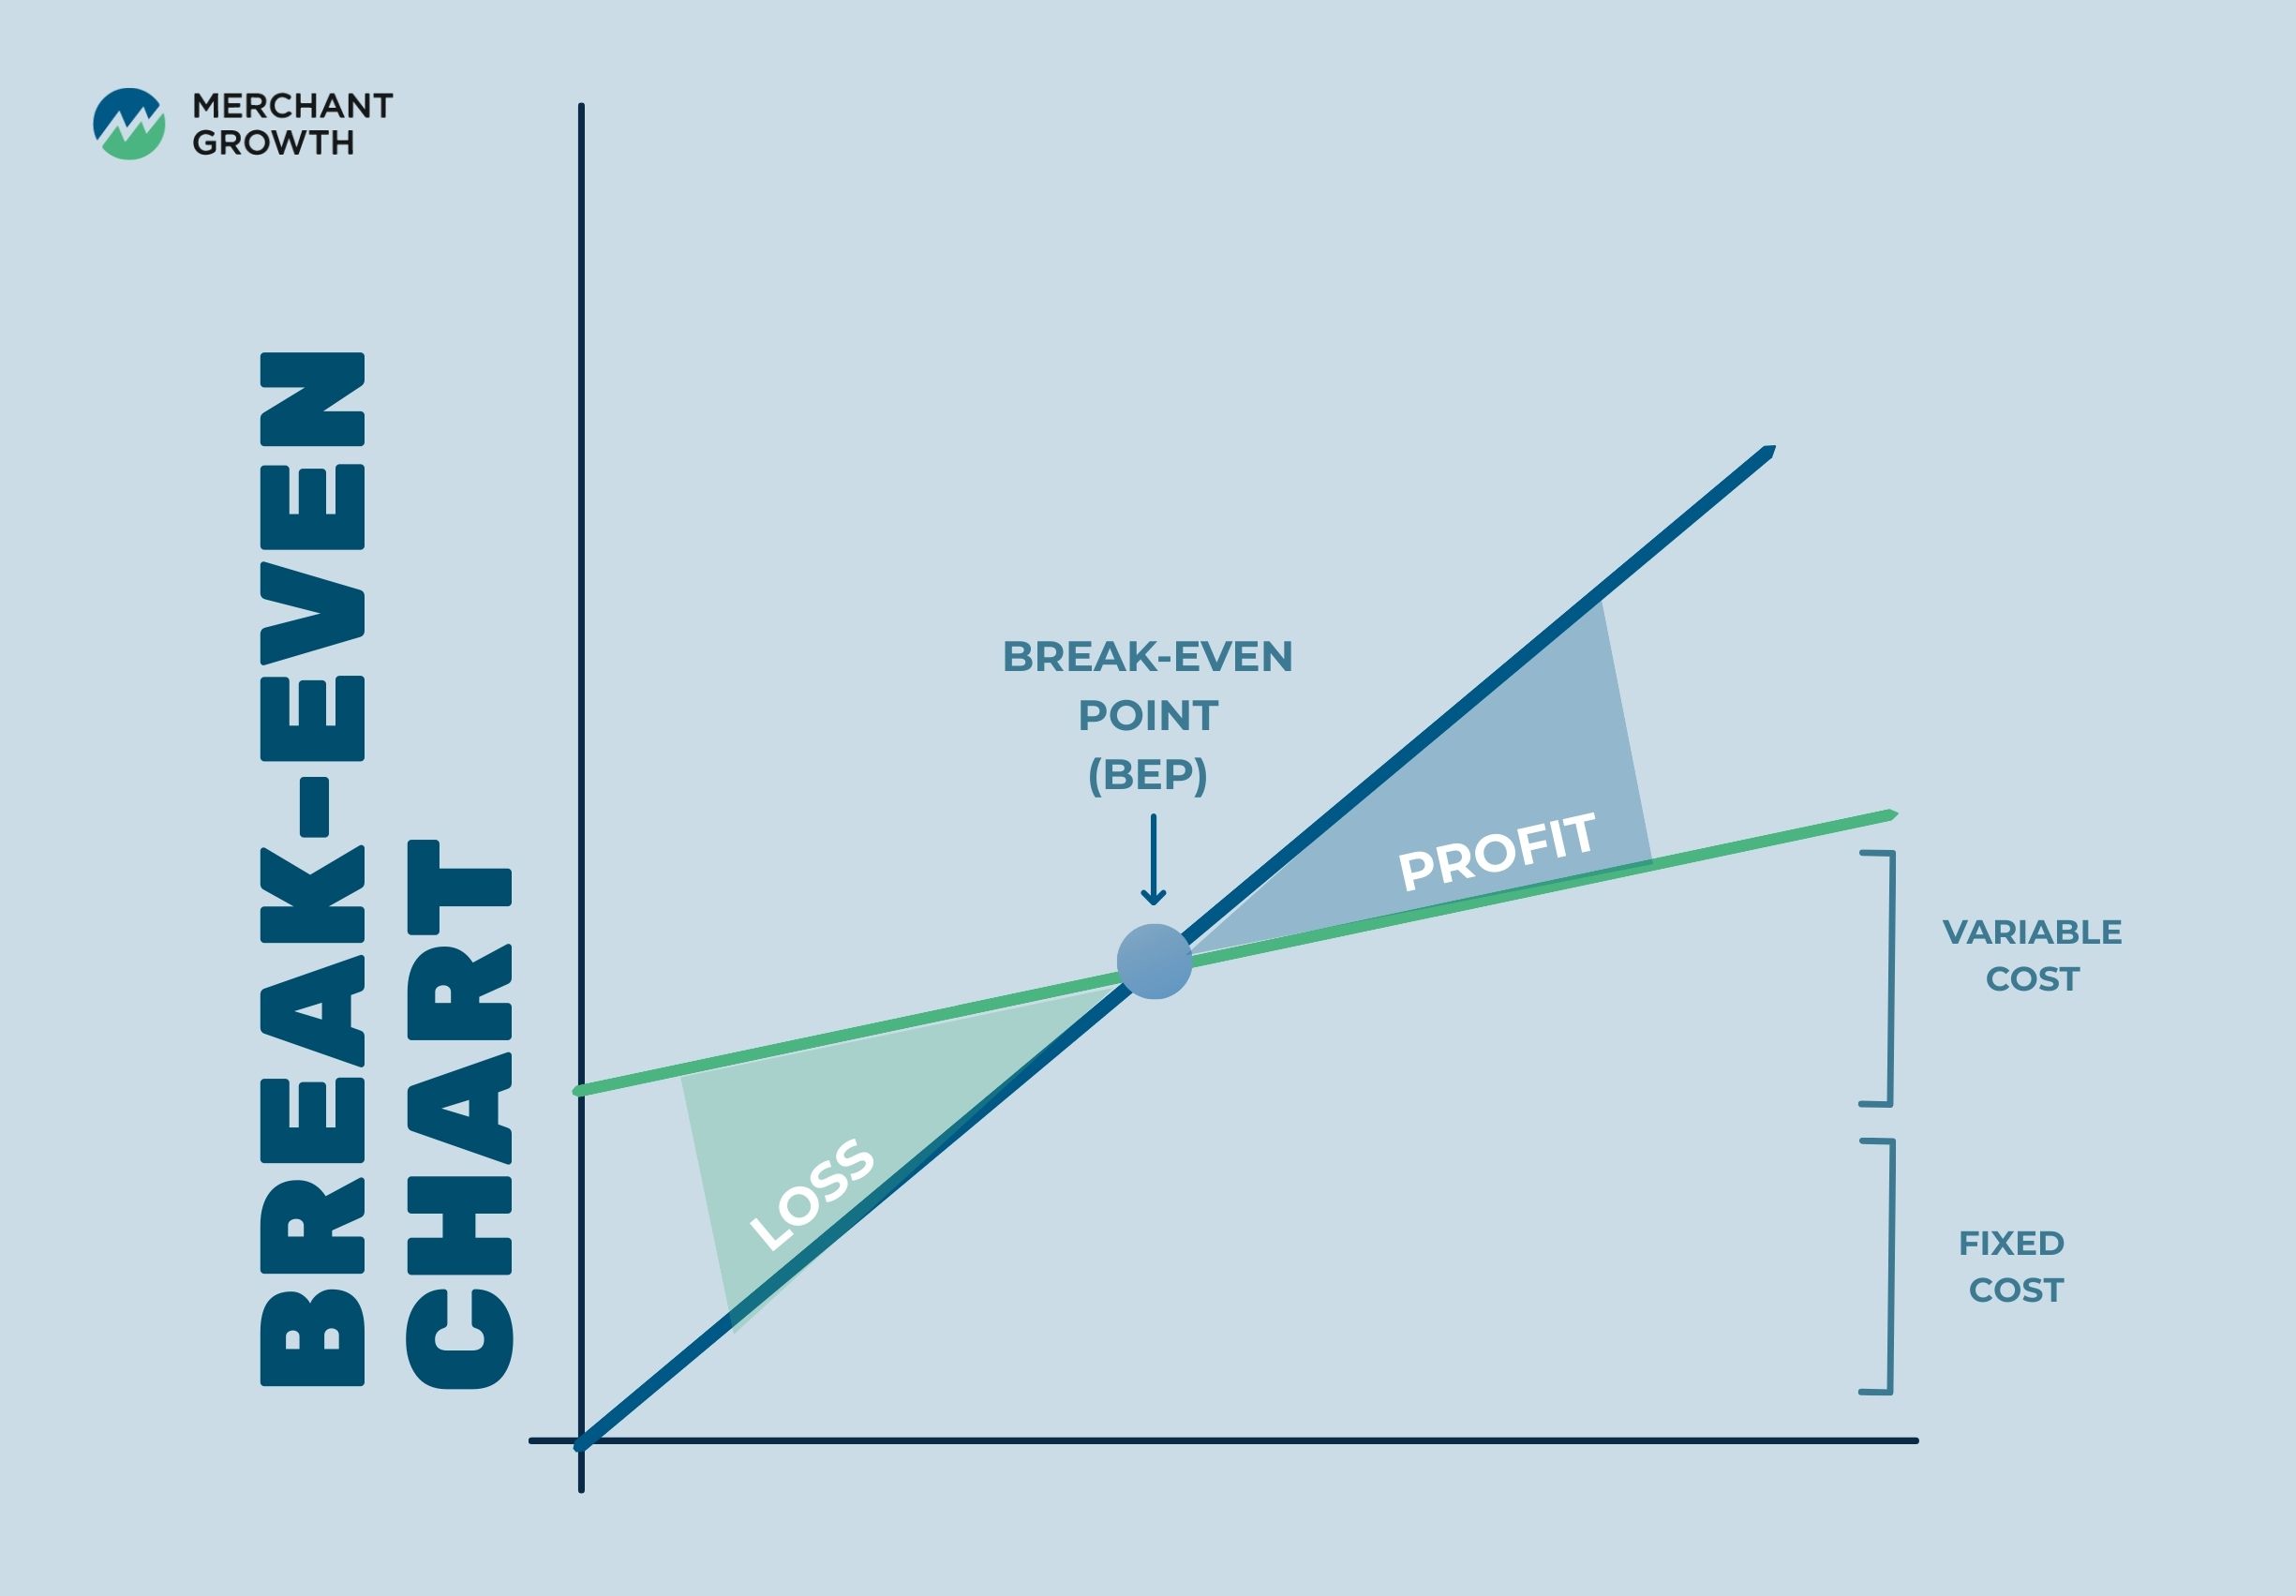
In a typical break-even chart, the horizontal axis represents sales volume, while the vertical axis represents both revenue and costs. Fixed costs appear as a horizontal line because they remain constant regardless of sales activity. Meanwhile, total costs gradually increase as production grows due to rising variable expenses.
The revenue line rises alongside sales volume. The point where the revenue line intersects with the total cost line represents the break-even point. This visual representation makes it easier for business owners to see how adjustments in pricing, cost structure, or production levels can influence profitability.

Why Break-Even Analysis Matters for Business Owners
Break-even analysis is more than just a financial calculation. For many business owners, it becomes a valuable planning tool that helps guide important decisions about pricing, growth, and cost management.
By understanding the break-even point, companies can set realistic sales targets and evaluate whether a business idea is financially viable. It also provides insight into how pricing strategies and operational costs influence profitability.
For established businesses, break-even analysis helps assess the potential impact of new initiatives such as launching products, expanding operations, or entering new markets. Rather than relying on guesswork, business owners can use this analysis to make more informed decisions based on financial data.

Is a High Break-Even Point Good?
A higher break-even point means a business must generate more sales before it begins earning profit. In some cases, this may indicate higher financial risk, especially if revenue fluctuates or market demand is uncertain.
However, a high break-even point is not always a negative sign. Certain industries require substantial upfront investments in equipment, technology, or infrastructure. Businesses operating in these sectors often expect higher break-even thresholds because their fixed costs are larger.
Ultimately, the key question is whether the required sales volume is realistic. If demand is strong and the business model is sustainable, a higher break-even point may simply reflect the scale of the operation.
Common Break-Even Analysis Mistakes
Although break-even analysis is a useful tool, it can produce misleading conclusions if important factors are overlooked. Many mistakes occur when businesses rely on incomplete cost estimates or outdated financial assumptions.

Common errors include:
- Ignoring variable costs, which can lead to overstating profitability.
- Underestimating operating expenses, especially smaller recurring costs that add up over time.
- Assuming demand is guaranteed, even though market conditions can change.
- Failing to update calculations when costs, pricing, or production levels shift.
Regularly reviewing and updating break-even calculations helps ensure they remain accurate as the business grows and evolves.

The Limitations of Break-Even Analysis
While break-even analysis provides valuable insights, it is not a complete financial forecasting tool. The calculation assumes that prices, costs, and sales patterns remain relatively stable, which may not always reflect real-world conditions.
External factors such as changes in customer demand, economic trends, or competitive pressures can influence profitability in ways that break-even analysis alone cannot predict. For this reason, businesses often combine break-even analysis with other financial planning tools.
Budgeting, forecasting, and market analysis can provide additional context that helps business owners understand how their financial strategies may perform under different circumstances.

From Break-Even to Profitability: Planning the Next Stage of Growth
Reaching the break-even point is an important milestone, but it is only the beginning of a company’s financial journey. Once a business has covered its costs, the focus shifts toward sustaining profitability and building long-term growth.
At this stage, many companies begin investing in expansion opportunities such as hiring new staff, increasing marketing efforts, or purchasing additional inventory. These initiatives often require upfront capital before the resulting revenue is realized.
Merchant Growth supports Canadian businesses by providing flexible financing solutions designed to help companies move beyond break-even and continue growing. Access to working capital can help businesses manage cash flow, invest in new opportunities, and scale operations with greater confidence.
Move Beyond Break-Even and Grow Your Business
Understanding your break-even point is an important step toward building a sustainable business. When you know how much revenue is required to cover your costs, it becomes easier to set realistic goals and make informed financial decisions.
Merchant Growth provides flexible funding solutions designed to help Canadian small businesses manage cash flow, invest in growth, and scale with confidence. Whether you are expanding operations, launching new products, or strengthening your financial foundation, the right financing can help support your next stage of growth.
Explore Merchant Growth financing solutions to move beyond break-even and build a stronger future for your business.